Image Source:
http://www.physicsclassroom.com/Class/1DKin/U1L1e6.gif
Summary:
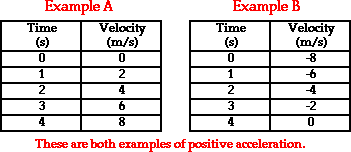
Acceleration is the change of velocity over time. Acceleration is usually shown as a curving line going upwards towards the top right corner. Deacceleration is shown as a curving line going downwards towards the bottom right corner. It could also be shown as a straight line if the graph has speed as the y-axis and time as the x-axis.
S&EP:
SP4: Analyzing and interpreting data
This week I worked on an acceleration document and a lab about acceleration. This is SP4: Analyzing and interpreting data because there was data there that I examined and found out which parts of the graph were an example of acceleration and what parts were a constant speed. That is how I performed SP4: Analyzing and interpreting data this week.
No comments:
Post a Comment